
A Pandas’ mini course experience with some labmates at the CNIO

Javi Lanillos
PhD candidate at CNIO
Right after the completion of my masters’ degree, by June 2018, I started to work as a bioinformatics technician at the Hereditary Endocrine Cancer group of the Spanish National Cancer Research Center (CNIO), in which I now do my PhD. A couple of months before starting this job in Madrid, a classmate told me about the Python’s library called Pandas. One of the first things I did as a bioinformatics technician was to start using Pandas on my own, which became more and more frequently used for any daily task. One of the main tasks as a bioinformatics technician was to perform pipeline analysis over hundreds of tumor samples which underwent targeted NGS (Next Generation Sequencing).
This work required to set up NGS data analysis pipelines, which can be made with great workflow managers (e.g., Snakemake, Nextflow) and the very many tools to process NGS data from .fastq files to annotated VCF (Variant Calling Format) files. But this was not the final report for my labmates’ experiments. We needed a readable format to explore the somatic variation across hundreds of samples at once. So, a big data table including all variation, all samples and all annotations of our choice would help us to not just spot interesting findings, but also be aware of artifacts derived from NGS technologies, group or arrange samples with common and different patterns, etc. I found it very effective to parse a multi-sample VEP (Variant Effect Predictor) annotated VCF file using Pandas and: perform column arrangement operations, string pattern extraction, multi-column operations for actions such as filtering (e.g. Variant Allele Frequency, Depth of Sequencing Coverage, type of mutation, effect on the transcript chosen as the “canonical”) or detection (what samples harbor a specific mutation and fulfill multiple conditions).
Excel is extremely useful, but limited for some operations
The previous paragraph is a long explanation for just a single task, which got me into the use of Pandas’ library. Another day, a labmate asked me to help merge the data from two experiments based on the EPIC 450K Methylation Arrays. The data consisted of two different data frames (each row was a methylation CpG island, circa half a million rows) with different samples, which had to be merged into a single dataframe based on CpG probe ids. Some labmates used to apply a vertical look up (“VLOOKUP”) search with Excel but these large files required a lot of RAM memory and they would freeze their monitors or end up crashing their computers. In addition, they would apply this operation manually as many times as the number of samples to merge. Pandas library offers .concat(), .merge() , .join() , .append() functions which would help you find a way of merging your data. Also, I often combined the .map() function and Python’s dictionary data structures to input external information into a dataframe. Whenever I quickly check some data in any dataframe, I load the file using Pandas in the shell using an iPython notebook. For example, the .groupby() function helps to summarize data in countless ways, or I usually parse text with the combination of self-made Python’s functions (def()), .str
, .apply() and lambdas, convert plain text to .xlsx or find a fast way to plot and share results with my labmates.
import pandas as pd all day, import pandas as pd all night
After two and a half years at the CNIO, Pandas is quite frequently imported at the very top lines of my Python scripts. Pandas is helpful to parse and extract data from diverse formats in bioinformatics (e.g., .gtf) and transform them into other formats (e.g., .bed). It is also at the core of some Python scripts which I run in parallel for the analysis of hundreds of dataframes which finally merged into one. Now, I try to learn more and more about transforming data frames in countless ways (e.g., combination of multiple Pandas functions like
.pivot(), .groupby(), .loc(), etc). “I surely realized that I was getting used to talking of any project and mentioning the Pandas’ library at any point [...], so, after knowing of some daily issues with dataframes, I started to ask my colleagues the other way around: what actions do you usually perform using dataframes?
The “vlookup” Excel function to merge data tables, formatting strings, manually curating data, multiple manual searches for genes names in .xlsx tables, apply statistical tests, sorting data, and a loooong etcetera, I found that we had in common the frequent use of data frames to explore data. From PhD students to senior researchers, from pure “wet-labbers” to bioinformatics wizards, I really felt like interacting with them and sharing time to learn and discuss data analysis in our research.
So, why not just get to know the Pandas’ library? How could we all participate without spending much time?
The safest (in this pandemic situation) and most flexible way was through an online minicourse. Although, I feared I could not make it the most interacting and intuitive channel to learn. However, we got the advantage that we all knew each other, which could help to increase the interaction. I took some time during two weeks to write down the activity and figure out some solutions to certain aspects and potential issues. I wanted the audience to be as broad as possible but took into special consideration those friends who were not used to any programming language or opening the “Terminal”.
Second, I asked what issues some colleagues had faced when doing data frame analysis and I decided to make up a toy exercise in which we could use some Pandas utilities and go through those issues. Another option would have been to explain some separated scenarios and solve them one at a time. Evenmore, I can imagine another option, in which participants previously pool their needs or issues and we work out some exercises that provide ideas or solutions.
Also, regarding technical issues, there are more ways of executing Pandas (and Python) than I really know. So, limited to what I have used and heard of, I thought of how we all were going to work during the activity. Or at least, offer a simple way for everyone. I thought it was easy to install Miniconda in any Operating System and get the necessary Python libraries with Conda or pip. A key technical tip from a colleague at the Bioinformatic Unit of the CNIO (thanks, Tomás) was to install Miniconda without Admin privileges, since some people would have to be working at the CNIO during the training, and Admin privileges are reserved to the IT department. I have also found a very nice blog which explains very well how to do it.
Once technical preparations were done, I sent an email to all members (from PIs to students) from labs associated with the Human Cancer Genetics Program at the CNIO and invited them to sign if they liked the idea. These colleagues are closer to me because we all participate together in weekly Lab Meetings and Journal Clubs sessions and I found it easy to invite them in this first attempt to a Pandas’ minicourse and learn myself with this first experience. After getting the list of participants, I sent those another email to follow some installation instructions and links to some data I had prepared before.
How did it go? Me: It was great!
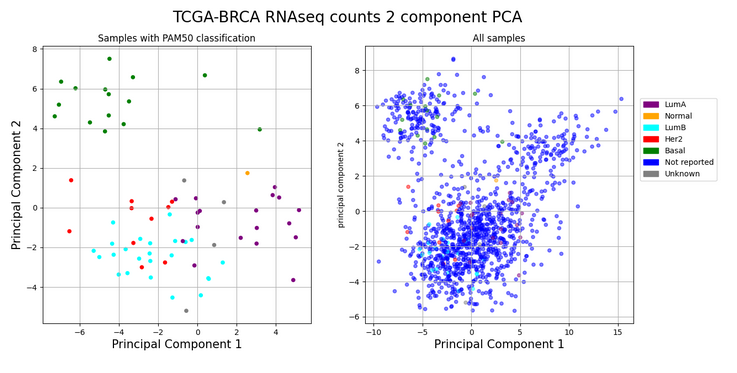
I chose a cancer-research related topic and proposed to load publicly available RNAseq count datatables at the UCSC Xena Browser from the TCGA-BRCA (The Cancer Genome Atlas – Breast Cancer) cohort and explore the PAM50 classification. In brief, PAM50 is a classification of a breast cancer tumor into a molecular subtype based on a specific gene expression signature derived from microarray data which confers invaluable prognostic information in the clinics. So, the proposal was, based on RNAseq data counts from the TCGA-BRCA, could we convert gene expression from the PAM50 genes into a 2-D plot showing the first two Principal Component Analysis axes? This way, we could practice on reading dataframes, extract the information we needed using Pandas, make use of other Python’s libraries such as the Scikit-learn and end our exercise with a figure using Matplotlib too.
30 people from seven labs signed for participation in either the first or the second day, or both! During the two-hour Zoom meeting, I quickly went through some slides with the installation instructions, the motivation for this course and introduced the exercise. Later, I asked them to execute the code in their Terminals while I was explaining step-by-step what we were doing. I asked them to interrupt me at any moment and they also used the “chat” option in Zoom to copy and paste some execution errors. During the first session, as part of the deal with “live-coding streaming issues”, we found for example that some people had to replace at some extent in the code the single quotation marks (‘’) with double quotations (“”). It seemed to be related to their specific OS and miniconda distribution versions.
Okay, but how did it go to them?
Overall, through a brief and anonymously-answered survey to better collect their opinions and impressions, the general feeling of 15 participants about content/duration balance was “okay” (not too short, not too long). Most of them were Undergraduate/Graduate and PhD students, and there were some senior researchers and technicians too. I was glad to see high heterogeneity regarding their expertise with programming (in general, Python, R…), from users which only use Excel to “fair enough/advanced” programming users, including some of them whose programming skills are getting rusty and wanted to refresh it. “Excel” was the most common way to load and work with dataframes in their daily activities, followed by minor cases with “plain-text”, “comma-separated files”, “dataframes in general using R, and dealing with “TSV” and “VCF” files. Of course, in Human Cancer Genetics labs, we work with dataframes for mutations, gene expression or clinical data analysis. 60% of them used Windows OS and 70% had heard before of Miniconda, the terminal and Python (actually, all of them knew of Python). Only 40% had heard of Matplotlib and/or Scikit-learn libraries too. As expected, more than 90% of people replying had worked previously with dataframes, although 2 of them did not.
Also, we had an interesting debate about the use of Python instead of R. I am much more confident programming with Python since it’s the language I mostly practice during my masters and I do confess the use of Pandas has tightly fixed my preference for Python (while talking about dataframes). I am certainly not experienced enough to talk about it, and evenmore, bioinformatics/IT forums are flooded with posts about this topic. If you want to know more, you can start with this one in Biostars. As a bioinformatics PhD student, my aim is to expand my programming skills and solve my research questions using the smartest solution (by “smartest”, I mean “easiest”, “most computationally powerful”, “as close as possible to the state-of-the-art”, “more robust”,…). Who said programming is addictive? The more programming I learn, the more time I’m willing to spend on it. Hey, someone made an interesting question about parsing larger (let’s say ~20GB) VCF files using Pandas. This brought up other issues such as manually modifying a VCF, which can break the right formatting. I’d rather use other bioinformatics tools to handle big VCFs files. Also, I would even split and parallelize the problem. But, if at some point, some lines of code with Python were to make my day, apart from trying out with Pandas, I am starting to read about other libraries for “larger data” such as Dask, Vaes and PySpark. However, this topic is far from being an “introductory minicourse to Pandas”. Finally, some days after, I knew that some of them could not finish the whole exercise for various reasons and errors while executing the code. Of course, I desired all of them to achieve the final figure, but I’m happy to hear that all of them have been up to a two-hour gap to learn how to open the terminal, install Miniconda, discover iPython and run some code using Pandas.
Some final and cheering thoughts
Two main topics for me to reflect on are what kind of practical exercises they were more keen to do and also, to make sure that main concepts had been clear after the exercise. Regarding the first question, it seemed to be multiple likings. I offered them to choose either: a) I prefer to learn one Pandas utility at a time and end up having a “Pandas cheat-sheet”, b) I prefer to practice with a “made-up” exercise such as the one proposed in this minicourse, c) I would bring my own examples and problems and practice over possible solutions, d) all of them. I’m glad to see that 65% were open to getting “all of them”, but also really interested to see how they could have gotten introduced to Pandas by using other different approaches.
Big thanks to all participants which made this initiative possible. Whether they will use it or not, Pandas can become more or less useful for each of you. I do think we have accomplished the main goal of getting introduced to this wonderful Python’s library and also, sharing some time to get to know each other’s work, which I’m sure is the way to accelerate our work in cancer research.
The main message: Pandas library can be quite helpful in your daily data analysis projects!